
How does the weather affect solar panel performance? The temperature, the season, the cloud cover, the air pollution and the humidity all have an effect on how much electricity your system generates.

The impact of temperature on solar panel performance
Conversely, the higher the atmospheric temperature, the lower is the energy generation from the solar cells. Solar panels work more efficiently in cold temperatures.
The Increase in temperature reduces the band gap of a semiconductor, like other electronics, solar panels work more efficiently in cold temperatures.
In a solar cell, the parameter most affected by an increase in temperature is the open-circuit voltage. As the temperature rises, the panel generates less voltage and becomes less efficient, producing less electricity. The temperature increase can affect the solar panel efficiency by 8%-15%.
To determine the effect of temperature on production, the datasheet of the manufacturer mentions the temperature coefficient. The temperature coefficient expresses the effect of the module temperature deviation from 25°C.
In general, for each degree above 25 degrees (known as a standard testing condition, or STC), the panel will become one per cent less efficient. For each degree below 25 degrees, it will become one per cent more efficient. The formula for power loss is as follows:
POWER LOSSES (%)= T COEFFICIENT X (NOCT – 25 ºC)
To understand it in more clarity let’s take an example of a datasheet of a solar panel below:
| TP300 SERIES (Multi-crystalline) | STC |
|---|---|
| Nominal power output (W) | 335 |
| Power tolerance (W) | 0 ~ +5 |
| Module efficiency (ŋ%) | 16.82 |
| Voltage at Pmax VMPP (V) | 37.6 |
| Current at Pmax IMPP (A) | 8.91 |
| Open-circuit voltage VOC (V) | 45.5 |
| Short-circuit current ISC (A) | 9.3 |
| NOCT( °C) | 44±2 |
| Module efficiency (% / °C) | -0.06 ± 0.01 |
| Temperature Coefficient of Pmax (% / °C) | -0.395 |
| Temperature coefficient of Voc (% / °C) | -0.307 |
| Temperature coefficient of Isc (% / °C) | 0.052 |
So the figures given are:
- 335 W rated panel
- Temperature Coefficient of Pmax= -0.395%/ ºC
- NOCT= 44 ºC
Power losses (%) = 0.395 x (44– 25) = 7.505%
That means we lose at least 7.505% of the rated power when we start actually using the PV panel. In other words, the maximum power that we can expect from this panel is about 310 W from a 335 W Panel at 44 ºC, temperature of a cell.
It is important to note that the temperature of the cell is higher than the surrounding atmospheric temperature. The cell temperature can be 50 ºC, while the atmospheric temperature is only 25 ºC.
The manufacturer also gives the IV Curve at multiple temperatures, from which also the change in the voltage and hence power can be found out.
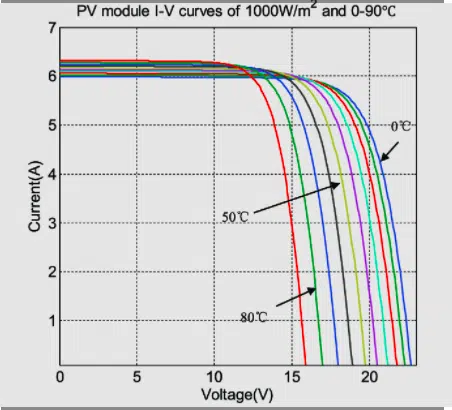
The IV Curve shows the effect of the change in temperature on current (I) and Voltage (V). From the graph, it is evident that the increased temperature results in a drop in voltage. The current remains more or less constant.
But even though solar panels are more efficient in cold weather, they don’t necessarily produce more electricity in the winter than in the summer. The sunniest weather is often in the summer when the temperature is the warmest. In addition to fewer clouds, the sun is out for a longer part of the day, so even though your panels are less efficient in warm weather, they will likely produce more electricity.
The impact of seasons on Solar Panel Performance
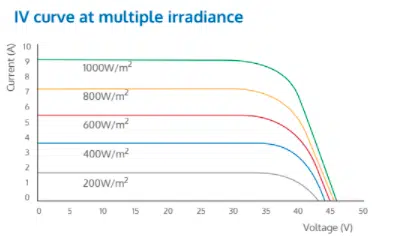
The effect of radiation (irradiance) on the power produced.
The weather condition causes a change in temperature and/or irradiance ( amount of solar light coming per unit area on panel) which in effect changes the solar panel power production. The effect of temperature change has already been covered above. The graph on the left shows the effect of irradiance on the current produced from the panel.
We can observe from the graph that with the lowering of solar radiation the output power reduces due to the reduction in current produced from the panel.
| MONTH | Solar Radiation | AC Energy from Panel |
|---|---|---|
| (KWh/m2/day) | (KWh) | |
| January | 5.49 | 629 |
| February | 6.16 | 622 |
| March | 6.74 | 719 |
| April | 6.69 | 673 |
| May | 6.42 | 676 |
| June | 5.23 | 564 |
| July | 4.8 | 547 |
| August | 4.95 | 556 |
| September | 5.29 | 578 |
| October | 5.51 | 612 |
| November | 5.22 | 570 |
| December | 5.1 | 591 |
| Annual | 5.63 | 7337 |
| Typical 5 Kwp Panel production in Dhanbad | ||
The above chart shows the typical solar radiation received by a 5 Kwp panel per day and the AC output generated from the panel each month.
The solar radiation and the power output from the panel varies with season, as is apparent from the above diagram.
From the diagram you will observe that the maximum solar radiation is in the summer season(April To June) , followed by spring and autumn (Feb., Mar and Sep., Oct), then winters(Nov to Jan.) and least in rainy seasons (July and Aug).
During summer, the sun shines for a longer period of time hence the solar radiation/day is maximum, the AC Energy is high as a result though with the increase in temperature the solar cell efficiency reduces. Also, note due to this temperature difference of months the AC output is maximum in March though the solar radiation is highest in April.
On cloudy days, the solar radiation gets reduced due to the cloud cover. This reduces the solar radiation and the AC energy output, though the temperature is cooler than in summers.
In winters the temperature is cooler but the hours of sunshine is lesser hence the solar radiation reduces, the AC energy increases due to lower temperature but still is less than the summer days.
In spring (Feb, Mar), the solar radiation is higher than autumn and hence more solar radiation and AC energy is produced.

The Impact of Cloudy Weather on the Solar Panel Performance
The clouds reduces the solar radiation reaching the solar cells. As a general rule, anything that comes in between panels and the sun will reduce the amount of solar energy produced from the system.
Be it clouds in the sky, fog on the surface, or shade from a nearby tree.
Thin Layer of Clouds: The panels could still produce electricity on cloudy days but that depends on how thick the cloud coverage is.
On a partly cloudy day, the energy production can drop by 10% to 25%, depending on how frequently the clouds are passing over the solar system.
However, sometimes the thin cumulus clouds while passing over the system can actually intensify the sunbeam and can lead to a brief increase in electricity production. This is called the “edge of cloud” effect and is caused by the wispy edges of the cloud that act as a magnifying glass, causing a stronger beam of sunlight to hit the panels.
Thick Layer of Clouds: What about overcast days?
Thick layers can cause very little to no production of electricity.
There is a quick way to check if the solar system is producing energy.
Look at the shadow cast by the objects, if you can see objects casting a shadow, your system is probably producing in some capacity. If you don’t see a shadow, it’s likely that the cloud coverage is too thick to produce electricity.
Overall, the panels will produce about 10 – 30% of the electricity on cloudy days as compared to sunny days, but it’s still advisable to go solar.
However, this aspect should be taken into account when calculating solar production to prepare a well-informed decision based on your situation.
And if you are using the solar for net metering, you’ll be able to use the electricity your system overproduces on sunny days to cover electricity on cloudy days.
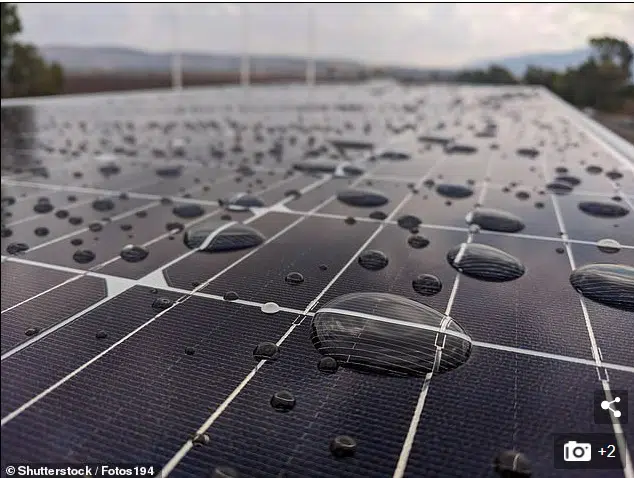
The Impact of Rain and Snow on the solar panel performance
The rain doesn’t have any impact on the solar production, it is the cloud that has the effect on the solar production.
However, the occasional rain cleans the solar panels, removing the layer of dirt and dust, which can increase the solar production. The dirt blocks the solar light resulting in decrease in energy production of the solar cell.
The snow cover blocks the solar light from reaching the solar cells so it can have a greater impact on the energy production. On cloudy, rainy or snowy days the solar production will reduce but still it’s a great option for many homes, businesses, and farms.
The Impact of the air pollutants on the solar panel performance
Air pollution adversely affects the energy generation from the solar plant.
The air pollutants scatter and reflect the light and increase the diffused light. This effect is not taken into consideration while designing the solar plant.
A study was conducted on the effect of air pollution on Delhi and Singapore to derive an empirical relation between reduction in insolation and fine particulate matter (PM2.5) concentration.
For Delhi, it was found that insolation received by silicon PV panels was reduced by 11.5% ± 1.5% or 200 kWh m−2 per year between 2016 and 2017 due to air pollution.
This experiment was extended for the analysis to 16 more cities around the planet and estimated insolation reductions ranging from 2.0% (Singapore) to 9.1% (Beijing).
source:Urban haze and photovoltaics
The Impact of wind speed on the solar panel performance
The wind speed may affect the climate temperature. The wind speed as such has no significant effect on the solar panel energy production, it is the climate temperature which has effect on the solar panels.
The Impact of Humidity on the solar panel performance
The humidity adversely affects the solar panel production, by absorbing the solar radiation reaching the solar panel. The study was conducted to observe the effect of humidity on the solar panel production.
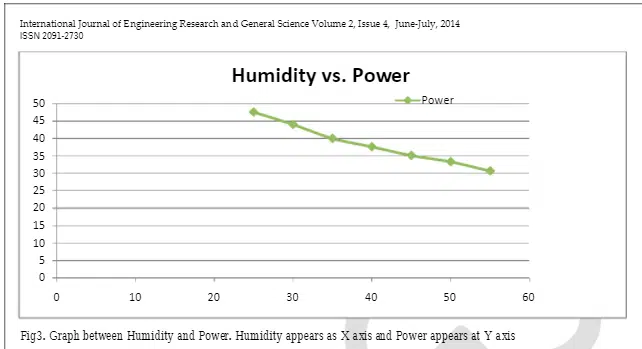
- It was observed that for a 5% increase in humidity there is a 7.5% reduction in power;
- for a 10% increase in humidity there is a 15.85% reduction in power;
- for a 15% increase in humidity there is a 20.89% reduction in power;
- for a 20% increase in humidity, there is a 26% reduction in power;
- and for a 25% increase in humidity, there is a 30% reduction in power
- It was observed that for a 5% increase in humidity there is a 7.5% reduction in power;
- for a 10% increase in humidity there is a 15.85% reduction in power; for a 15% increase in humidity there is a 20.89% reduction in power;
- for a 20% increase in humidity there is 26% reduction in power
- and for a 25% increase in humidity there is 30% reduction in power.
The cities where the humidity level is above the average range of 30 actually results in the minimal layer of water on the top of the Solar panel which results in decreasing efficiency.
As per the facts when the light consisting of energy/Photon strikes the water layer which in fact is denser, Refraction appears which results in decreasing intensity of the light which in fact appears the root cause of decreasing efficiency.
sources: 1.How Does Weather Affect Solar Panels’ Production?
2.Effect of humidity on the efficiency of the solar cell (photovoltaic)

Your blog post resonated with me on a deep level.
It’s clear that you have a true passion for the subject.”
https://www.jaysis.ai/
Thanks a lot Opex for your positive feedback
Thanks a lot Opex. Your remarks has encouraged me to write further.
Great information, big help on tracking a set of solar panels, installed in South Carolina. SC is steamy in the summer, and this thick air is dulling down the kilowatt output, even on a so called clear day. While looking horizontally down range on the interstate; the air looks thick (foggy).
Thanks a lot Joseph for your positive feedback
Thanks a lot Joseph, sorry for late response.